flow-control-benchmarks
Engine capacity and configuration
Business question
Which vLLM limits provide a useful throughput and latency balance before flow control policy is evaluated under production traffic?
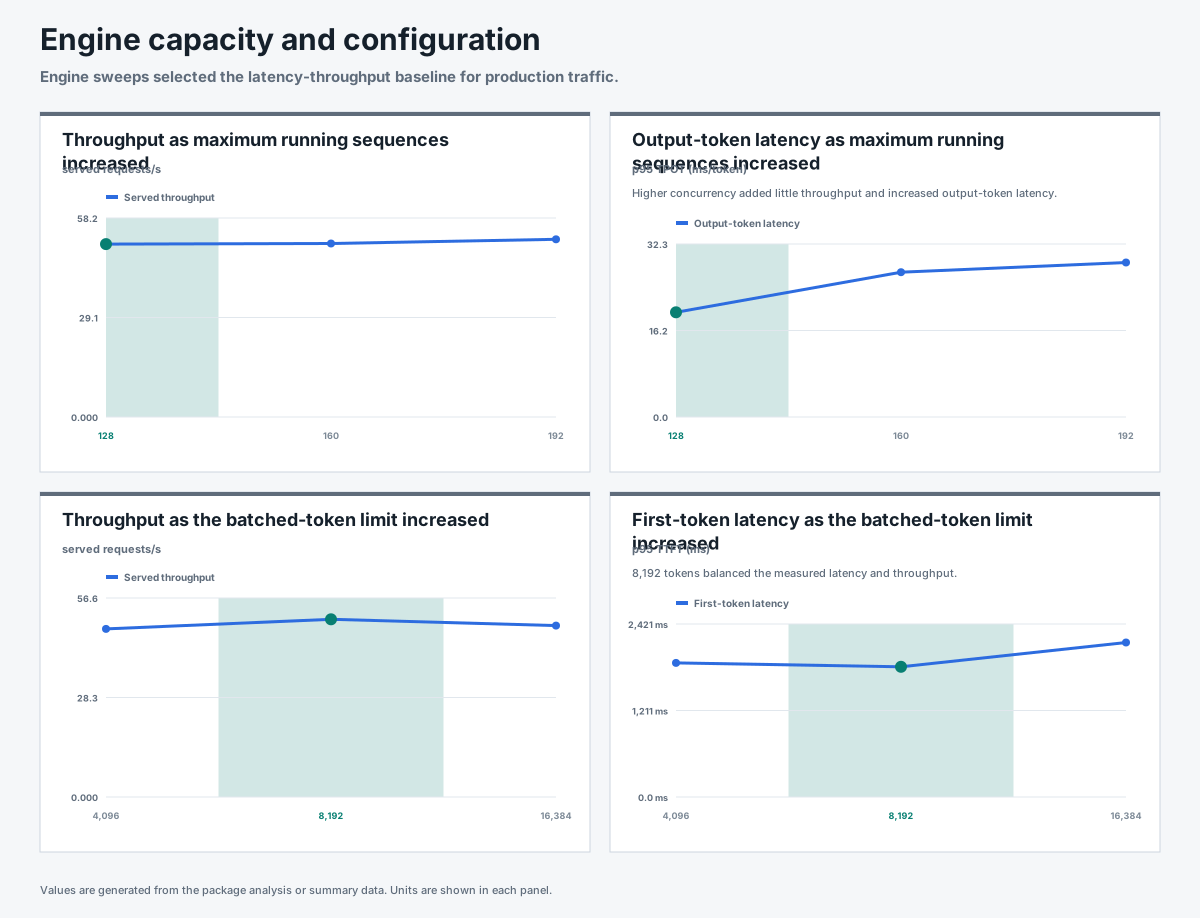
Answer. The tested balance was 128 maximum running sequences and 8,192 maximum batched tokens; higher sequence limits added little throughput and increased output-token latency.
Visual summary
Replay this package with Flow Control Flight Recorder
Result
The single-GPU capacity curve flattened near concurrency 128. Increasing closed-loop concurrency from 128 to 160 raised steady throughput from 49.0 to 50.7 requests per second while adding more waiting.
The matched engine sweeps selected:
max-num-seqs=128max-num-batched-tokens=8192
| Max sequences | Repeats | Steady RPS | p95 TTFT | p99 TTFT | p95 TPOT |
|---|---|---|---|---|---|
| 128 | 3 | 50.5 | 1,822 ms | 1,888 ms | 19.6 ms/token |
| 160 | 3 | 50.7 | 1,365 ms | 1,978 ms | 27.0 ms/token |
| 192 | 3 | 51.9 | 1,691 ms | 2,613 ms | 28.9 ms/token |
Sequence limit 128 gives up little throughput while avoiding the higher TPOT and tail-latency cost at the larger limits.
| Max batched tokens | Repeats | Steady RPS | p95 TTFT | p95 TPOT |
|---|---|---|---|---|
| 4,096 | 1 | 47.8 | 1,877 ms | 20.5 ms/token |
| 8,192 | 3 | 50.5 | 1,822 ms | 19.6 ms/token |
| 16,384 | 1 | 48.7 | 2,162 ms | 22.8 ms/token |
The alternatives did not improve throughput or latency enough to justify more repeats.
Method
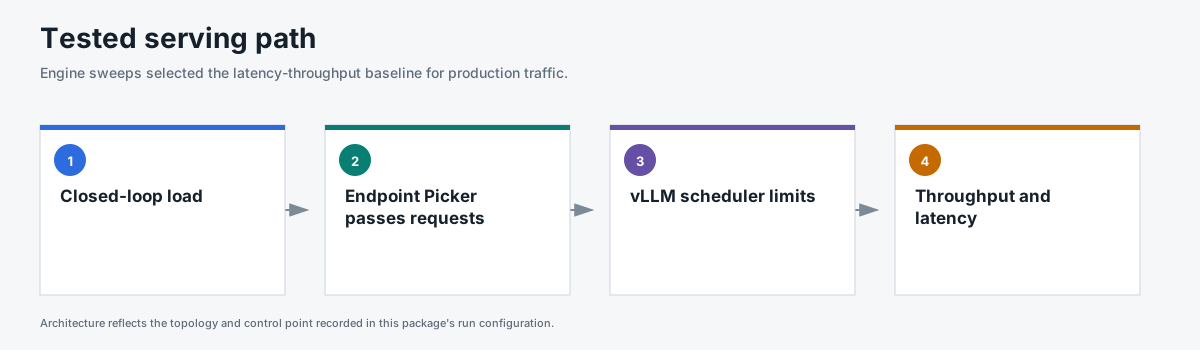
- One llm-d Endpoint Picker v0.9.0 served one vLLM model replica on one NVIDIA H100.
- Prefix caching was disabled and verified by configuration and counters.
- The capacity curve tested closed-loop concurrency from 8 through 160.
- The sequence sweep fixed concurrency at 192 and tested limits from 64 through 192.
- The batched-token sweep fixed
max-num-seqs=128and tested 4,096, 8,192, and 16,384 tokens. - Every retained run captured request rows, traffic samples, direct metrics, Prometheus metrics, route counts, cache counters, and configuration.
The complete shared configuration is in run-config.json.
What remained fixed
The model, one H100 GPU, one Endpoint Picker v0.9.0, 32,768-token model limit,
90% GPU-memory target, cache-off state, runner, seed, warmup, and metric cadence
remained fixed. The sequence sweep held concurrency at 192 while changing
max-num-seqs. The batched-token sweep held max-num-seqs=128 while changing
max-num-batched-tokens.
Evidence
| File | Contents |
|---|---|
summary.csv |
One row per retained sweep run with throughput and latency in explicit units. |
request-results.csv |
One sanitized row per request. |
traffic-samples.csv |
Issued, completed, and outstanding requests over time. |
system-metrics.csv |
Curated Endpoint Picker and vLLM metrics. |
run-evidence.csv |
Metrics, routes, cache state, headers, and proof-gate results. |
analysis.json |
Selected settings, matched medians, and claim boundary. |
Scope
This is closed-loop engine calibration, not an SLO proof. The selected settings are the starting point for the open-loop production scenarios published separately.
Reproduce
This package used the native closed-loop runner with cache off. max-num-seqs was tested at 64, 96, 128, 160, and 192. max-num-batched-tokens was tested at 4,096, 8,192, and 16,384. The selected point and its nearest boundaries were repeated three times.
OUTPUT_DIR=${OUTPUT_DIR:-results/engine-configuration}
PROMPT_CACHE_DIR=${PROMPT_CACHE_DIR:?Set the generated prompt-cache directory}

pipeline/run-in-cluster.sh \
  "$OUTPUT_DIR" "$OUTPUT_DIR/live-status.json" "$PROMPT_CACHE_DIR" "" -- \
  --sweep-points 192 --sweep-duration 180 --skip-scenarios \
  --prompt-pool-size 24 --warmup-duration 30 --warmup-concurrency 2 \
  --steady-state-trim-s 30 --metric-sample-interval-s 0.5 \
  --vllm-prefix-caching off --traffic-seed 42 --arrival-mode closed_loop
Run the command after setting vLLM max-num-seqs to each of 64, 96, 128, 160, and 192. With max-num-seqs=128, repeat it after setting max-num-batched-tokens to 4,096, 8,192, and 16,384. Use a distinct OUTPUT_DIR for every setting and repeat. run-config.json records the complete matrix.