flow-control-benchmarks
Production scenarios
Business question
Can one shared model server preserve priority separation and same-priority fairness across production-shaped surge traffic?
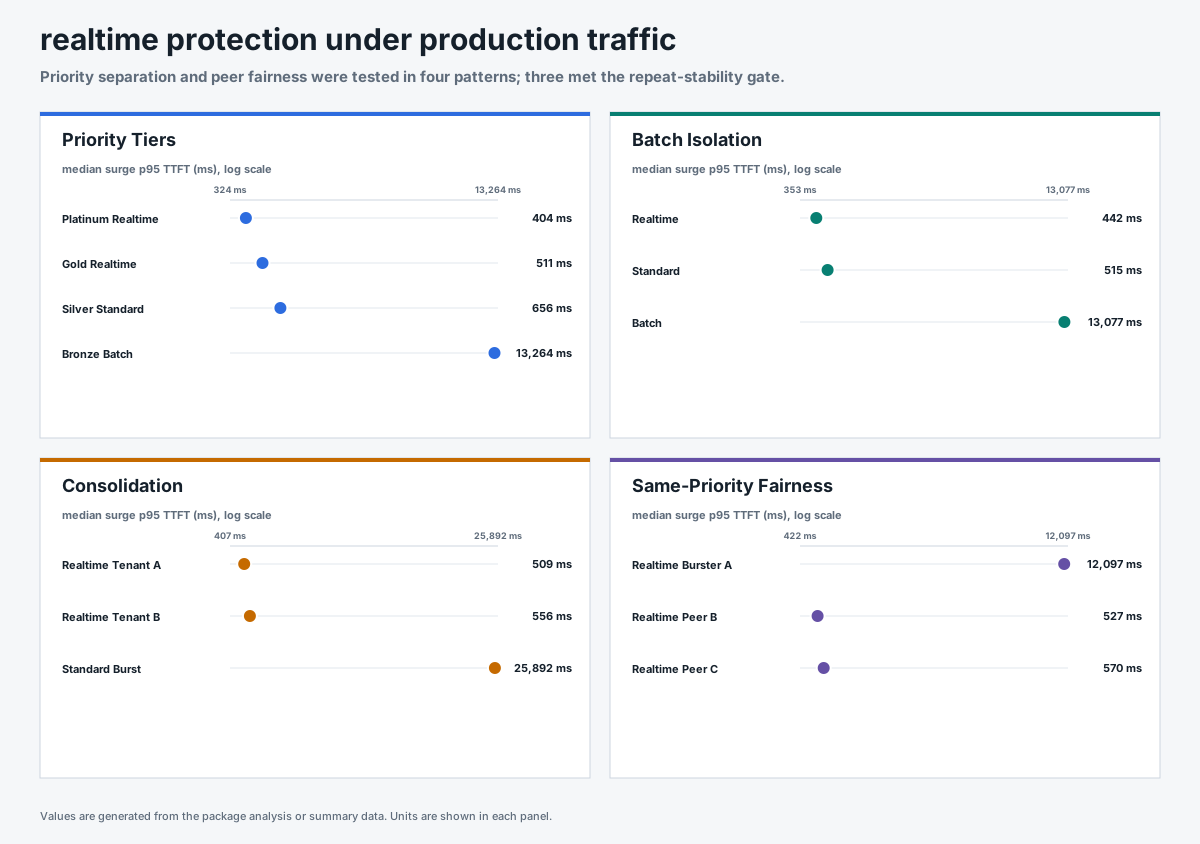
Answer. Lower-priority work absorbed most of the queuing delay in three mixed-priority scenarios, while in a separate same-priority test with round-robin explicitly configured, two peer tenants remained below 700 ms p95 TTFT as the bursting tenant reached 12,097 ms.
Visual summary
Scenario packages
Each scenario has its own folder. No request, traffic, metric, or proof CSV is aggregated across scenarios.
| Scenario | Question | Evidence |
|---|---|---|
| Priority tiers | Does dispatch order preserve the four configured priority bands during a surge? | 3 selected repeats |
| Batch isolation | Can realtime and standard work retain lower TTFT while batch absorbs more of the queue? | 3 selected repeats; 1 queue-depth calibration |
| Consolidation | Can two realtime tenants retain lower TTFT while standard traffic surges? | 3 matched repeats for each of 3 detector settings |
| Same-priority fairness | Can peer tenants keep receiving service while one tenant in the same band overloads the shared model? | 3 matched repeats for each of 2 detector settings; 1 calibration |
Selected configuration
The request-count detector kept stable median p95 TTFT below 700 ms for the latency-sensitive tiers in priority tiers and consolidation, and for the two peer tenants in same-priority fairness. Batch isolation retained subsecond realtime and Standard medians while Batch reached 13,077 ms, but its repeat spread was too wide for a stable point estimate.
In same-priority fairness, peer medians were 527 and 570 ms, with ranges extended to 619 and 675 ms.
| Scenario | Measured result during the surge |
|---|---|
| Priority tiers | Platinum 404 ms; Gold 511 ms; Silver 656 ms; Batch 13,264 ms p95 TTFT |
| Batch isolation | Directional medians: realtime 442 ms; Standard 515 ms; Batch 13,077 ms p95 TTFT |
| Consolidation | realtime tenants 509 and 556 ms; Standard burst 25,892 ms p95 TTFT |
| Same-priority fairness | Overloaded tenant 12,097 ms; peers 527 and 570 ms p95 TTFT |
Each selected scenario uses three repeats. All requests succeeded, flow control engaged during every retained run, and the prefix cache remained off. Batch-isolation realtime p95 TTFT ranged from 371 to 669 ms (1.81× spread), and standard ranged from 436 to 1,017 ms (2.33×). Both exceed the 1.5× repeat-stability gate, so those medians are directional evidence.
Detector comparison
The matched comparison covers consolidation and same-priority fairness. The request-count detector kept realtime p95 TTFT ranges below the ranges measured with queue-depth 2 and queue-depth 5 in every matched consolidation run. It also kept both same-priority peers below 700 ms while queue-depth 2 produced peer p95 TTFT above 4,400 ms.
| Scenario | Detector | realtime p95 TTFT |
|---|---|---|
| Consolidation | Request count 128, 10% headroom | 509 and 556 ms |
| Consolidation | Queue depth 2 | 4,711 and 4,567 ms |
| Consolidation | Queue depth 5 | 5,117 and 4,906 ms |
| Same-priority peers | Request count 128, 10% headroom | 527 and 570 ms |
| Same-priority peers | Queue depth 2 | 5,023 and 4,519 ms |
The comparison uses three repeats per detector. The p95 TTFT ranges do not overlap, but three repeats support descriptive medians and ranges rather than a formal statistical-significance claim.
Method
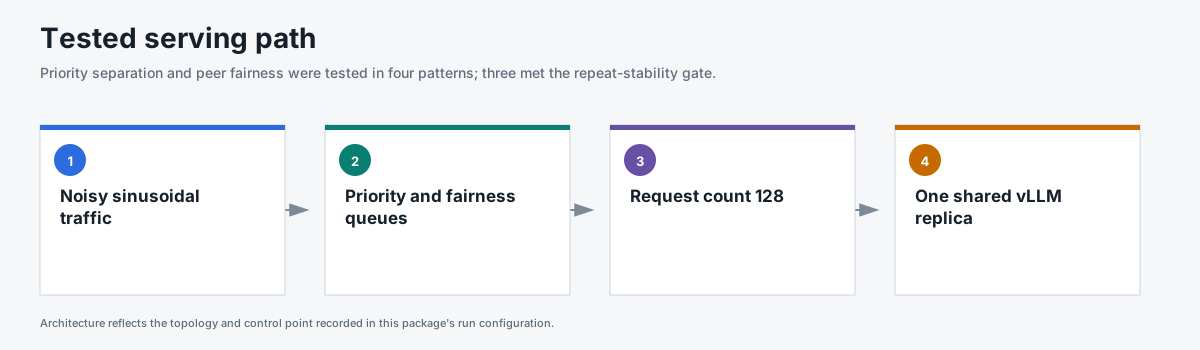
- One llm-d Endpoint Picker v0.9.0 served one vLLM model replica on one NVIDIA H100.
- vLLM used
max-num-seqs=128andmax-num-batched-tokens=8192. - The selected detector used request cap 128 with 10% headroom, or 15% for batch isolation.
- The benchmark explicitly configured round-robin fairness within each priority band and first-come-first-served ordering within each tenant queue. Stable v0.9 defaults to global-strict fairness when no fairness policy is configured.
- Traffic used open-loop Poisson arrivals with noisy sinusoidal phases, a timed surge, and recovery.
- Each request used 511 input tokens and 128 output tokens.
- Prefix caching was disabled and verified with zero query and hit counters.
- Pool saturation is a detector-normalized score. A value of 1.0 marks the configured boundary within each detector; raw values are not compared across request-count and utilization detectors.
- Every retained run captured request results, traffic, policy queues, vLLM running and waiting requests, KV-cache utilization, preemptions, route counts, headers, and flow-control engagement.
Evidence scope
The batch queue-depth-2 and same-priority queue-depth-5 runs are retained as single-run calibrations. The priority queue-depth controls failed route-count proof, and the batch queue-depth-5 control failed its response-outcome gate; those attempts are not included. Detector claims are limited to the matched consolidation and same-priority evidence.
Shared configuration and analysis
| File | Contents |
|---|---|
run-config.json |
Images, topology, engine settings, detector settings, and traffic method. |
analysis.json |
Matched medians, ranges, exclusions, and claim boundary. |
Each scenario folder contains its own summary.csv, window-summary.csv,
request-results.csv, traffic-samples.csv, system-metrics.csv,
run-evidence.csv, run-config.json, and analysis.json.
Reproduce
All four scenarios used GuideLLM 0.7.0, open-loop Poisson arrivals, noisy sinusoidal phases, seed 42, one Endpoint Picker, one model replica, random routing, and cache off. The selected configuration used request-count admission at 128 requests with 10% headroom. Consolidation and same-priority fairness also ran matched utilization-detector configurations at queue depth 2; consolidation included queue depth 5.
for SCENARIO in priority_tiers batch_isolation consolidation same_priority_fairness; do
  HEADROOM=0.10
  if [[ "$SCENARIO" == batch_isolation ]]; then HEADROOM=0.15; fi
  python3 pipeline/guidellm_trace.py \
    --scenario-file benchmark-data/upstream-flow-control-v0.9.0/production-scenarios/scenarios.json \
    --scenario "$SCENARIO" --out-dir "/tmp/$SCENARIO" --traffic-seed 42

  for REPEAT in 1 2 3; do
    python3 pipeline/run_guidellm_scenario.py \
      --manifest "/tmp/$SCENARIO/manifest.json" \
      --run-dir "results/$SCENARIO/request-count/repeat-$REPEAT" \
      --prefix "$SCENARIO-request-count-repeat-$REPEAT" \
      --namespace "${NAMESPACE:-flow-control}" \
      --runner-pod "${RUNNER_POD:-flow-control-benchmark-runner}" \
      --expected-detector concurrency-detector \
      --expected-concurrency-mode requests \
      --expected-max-concurrency 128 \
      --expected-headroom "$HEADROOM" \
      --expected-picker random-picker \
      --expected-prefix-cache off \
      --expected-model-replicas 1 \
      --http-version 1 --guidellm-worker-processes 4 \
      --drain-after-done --drain-timeout-s 300 --recover-multiline-sse
  done
done
Batch isolation used --expected-headroom 0.15; the other selected scenarios used 0.10. The child READMEs contain the exact utilization-detector comparison commands. scenarios.json contains the executable traffic definitions; each scenario folder contains only its own traffic and evidence.