flow-control-benchmarks
Selected workload shapes
Business question
Do the selected request-concurrency flow-control settings keep all requests served across representative single-tenant workload shapes under surge load?
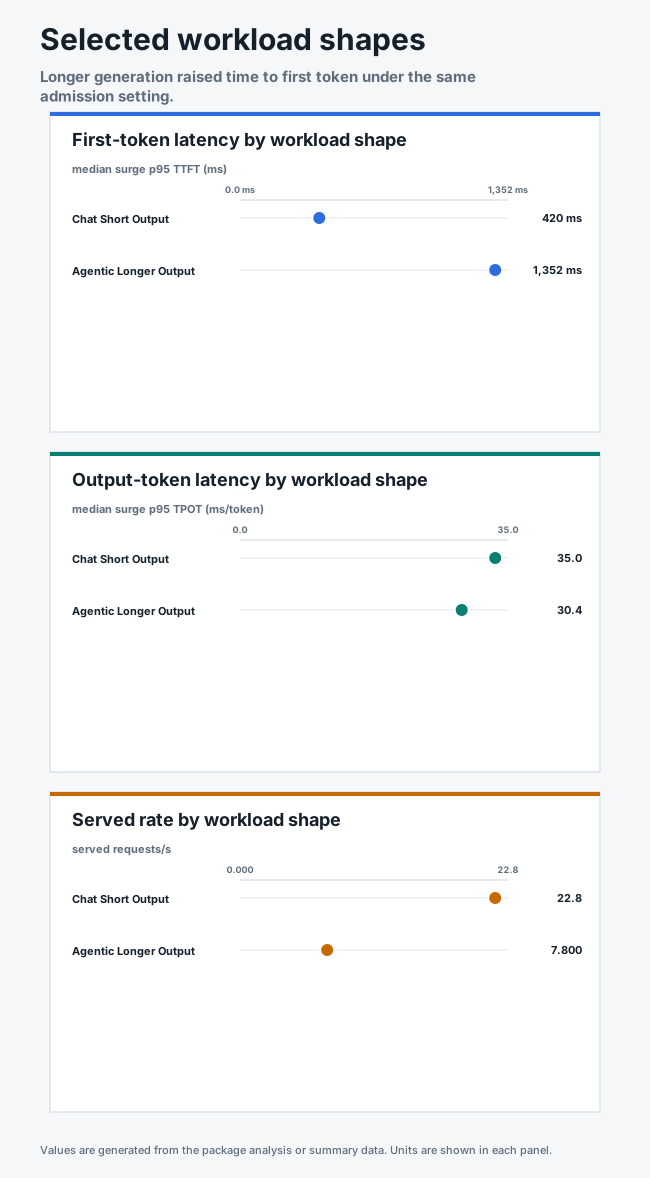
Answer. Every chat and agentic request completed, although the longer agentic output produced higher first-token latency.
Visual summary
Replay this package with Flow Control Flight Recorder
Result
All requests completed with HTTP 200 in all six runs. Flow control engaged in every run. vLLM recorded no preemptions and prefix cache counters remained zero in all runs. The Endpoint Picker did not restart.
| Workload shape | Repeat | Offered requests | Success | Surge p95 TTFT (ms) | Surge p99 TTFT (ms) | Peak EPP queue (requests) |
|---|---|---|---|---|---|---|
| chat short output | 1 | 2,947 | 100% | 420.2 | 723.7 | 16 |
| chat short output | 2 | 2,947 | 100% | 397.1 | 577.0 | 8 |
| chat short output | 3 | 2,947 | 100% | 439.1 | 590.6 | 11 |
| agentic longer output | 1 | 854 | 100% | 1,466.6 | 1,903.6 | 11 |
| agentic longer output | 2 | 854 | 100% | 1,352.3 | 1,925.6 | 11 |
| agentic longer output | 3 | 854 | 100% | 1,311.8 | 1,876.5 | 11 |
Median surge p95 TTFT: 420 ms (chat short output), 1,352 ms (agentic longer output).
Method
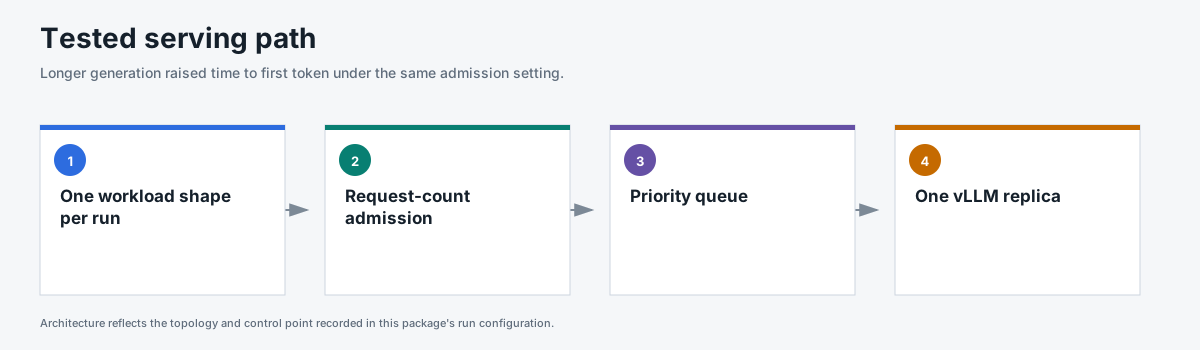
- One Endpoint Picker and one vLLM model replica on one NVIDIA H100 GPU.
- Each workload shape ran three fresh 180-second repeats. Its deterministic traffic schedule was identical across those repeats.
- Chat short output sent 1,024 input and 128 output tokens. Rate was centered on 12 requests/s during baseline and 24 requests/s during the surge window.
- Agentic longer output sent 4,096 input and 512 output tokens. Rate was centered on 2 requests/s during baseline and 7.5 requests/s during the surge window.
- Each shape ran as a single-tenant workload with one priority band.
- The Endpoint Picker used request-concurrency detection, a 128-request limit, 10% headroom, random model selection, and priority-aware flow-control queues.
- vLLM used
max-num-seqs=128,max-num-batched-tokens=8192, a 32,768-token model limit, and prefix cache disabled.
The complete configuration is in run-config.json.
Evidence
| File | Contents |
|---|---|
summary.csv |
Run-level latency, throughput, status, queue, KV cache, and restart results. |
request-results.csv |
One sanitized row per request with TTFT, TPOT, latency, token counts, and status. |
traffic-samples.csv |
Issued, completed, and outstanding requests by tenant over time. |
system-metrics.csv |
Curated Endpoint Picker and vLLM metrics collected during every run. |
run-evidence.csv |
Schedule, header, route, metric, cache, flow-control, and data-quality gates. |
analysis.json |
Per-run values, per-shape medians, claim boundary, and business answer. |
Scope
Each workload shape ran as a single-tenant single-replica workload. Results characterize per-shape behavior under the request-concurrency detector. They do not represent mixed-tenant or multi-replica deployments.
Batch and long-context workload shape evidence appear in their dedicated packages.
Reproduce
This package used GuideLLM 0.7.0, request-count admission at 128 requests, 10% headroom, random routing, one model replica, and cache off. Chat and agentic shapes each ran three times.
for scenario in chat_short_output agentic_longer_output; do
  python3 pipeline/guidellm_trace.py --scenario-file benchmark-data/upstream-flow-control-v0.9.0/selected-workload-shapes/scenarios.json --scenario "$scenario" --out-dir "/tmp/$scenario" --traffic-seed 42
  python3 pipeline/run_guidellm_scenario.py --manifest "/tmp/$scenario/manifest.json" --run-dir "results/$scenario" --prefix "$scenario" --namespace "${NAMESPACE:-flow-control}" --runner-pod "${RUNNER_POD:-flow-control-benchmark-runner}" --expected-detector concurrency-detector --expected-concurrency-mode requests --expected-max-concurrency 128 --expected-headroom 0.10 --expected-picker random-picker --expected-prefix-cache off --expected-model-replicas 1 --http-version 1 --guidellm-worker-processes 4 --drain-after-done --drain-timeout-s 240 --recover-multiline-sse
done
All four authored workload shapes remain in scenarios.json. The accepted chat and agentic run settings are in run-config.json.