Set engine capacity
Find an execution point that keeps the GPU fed without paying a large tail-latency penalty.
Carried forward: 128 sequences and an 8,192-token scheduler budget.
Can one shared model pool enforce priority and fairness under bursty, production-shaped traffic?
Answer: Across three mixed-priority scenarios, lower-priority work absorbed most of the queuing delay. In a separate same-priority test, two peer tenants remained below 700 ms p95 TTFT while a bursting tenant waited longer. Separate tests identified the tradeoffs among request-count, token-count, and backend-pressure admission signals.
Lower-priority work absorbed most of the queuing delay in three mixed-priority scenarios. In the fourth, configured round-robin fairness kept peer tenants moving within one priority band. The latency-sensitive priority tiers (Platinum, Gold, and Silver), realtime tenants A and B in consolidation, and peer tenants B and C in same-priority fairness met the 1.5× repeat-stability gate for surge p95 TTFT across three repeats. Batch isolation remained directional evidence.
Twelve evidence suites form one decision path. Calibration established a production starting point; later suites tested where it held, where another signal helped, and where stable v0.9 admission control stopped.
Find an execution point that keeps the GPU fed without paying a large tail-latency penalty.
Carried forward: 128 sequences and an 8,192-token scheduler budget.
Compare proactive request or token accounting with reactive queue-depth and KV-cache pressure.
Carried forward: request count 128 as the production starting point; other signals remained workload-specific options.
Exercise priority, fairness, request-shape variation, and the boundary created by work already running in vLLM.
Decision: keep request count as the reference, test input tokens for heterogeneous prompts, and state the after-dispatch limit explicitly.
Check whether the selected starting point survives more replicas, repeated surges, and a different routing strategy.
Boundary: scale and recovery held in the tested topology; prefix-aware routing did not justify a default change.
The production scenarios used one H100, one model replica, random routing, and prefix caching off unless a package states otherwise. Each linked suite records its own method, repeats, and claim boundary.
Three scenarios ask how priority tiers share one model pool. A fourth asks whether peers within one priority band keep receiving dispatch turns.
Range-plot key:Dot: median runLine: minimum–maximum across three repeatsPale area: under 1 second, shown as a reference—not an SLO
Platinum, Gold, and Silver recorded subsecond median p95 TTFT; Bronze Batch reached 13.3 seconds.
realtime and Standard recorded lower p95 TTFT than Batch in every repeat, but their repeat spread exceeded the stability gate.
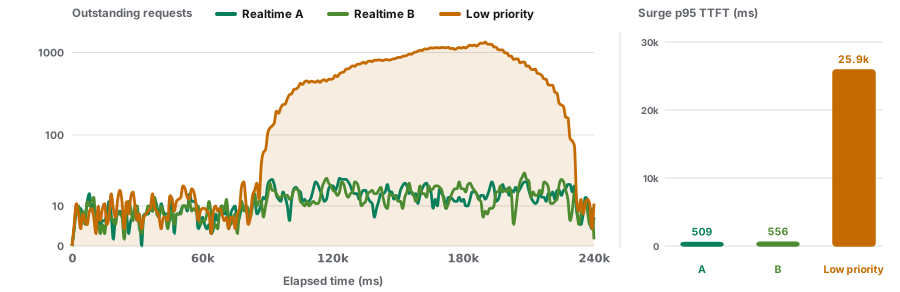
With round-robin explicitly configured, peers B and C stayed below 700 ms while tenant A generated the burst.
Priority tiers, Consolidation, and Same-priority fairness used 10% detector headroom; Batch isolation used 15%. Flow control engaged and policy queues were active in every retained run. The pale area in the three range plots ends at one second as a reading aid, not a declared service-level objective.
Each plot shows requests sent per second from 60 to 210 seconds and uses its own labeled y-axis range. The similar shapes are intentional: every scenario used the same surge window so differences in latency reflect the traffic mix and policy behavior. Prefix caching was off.
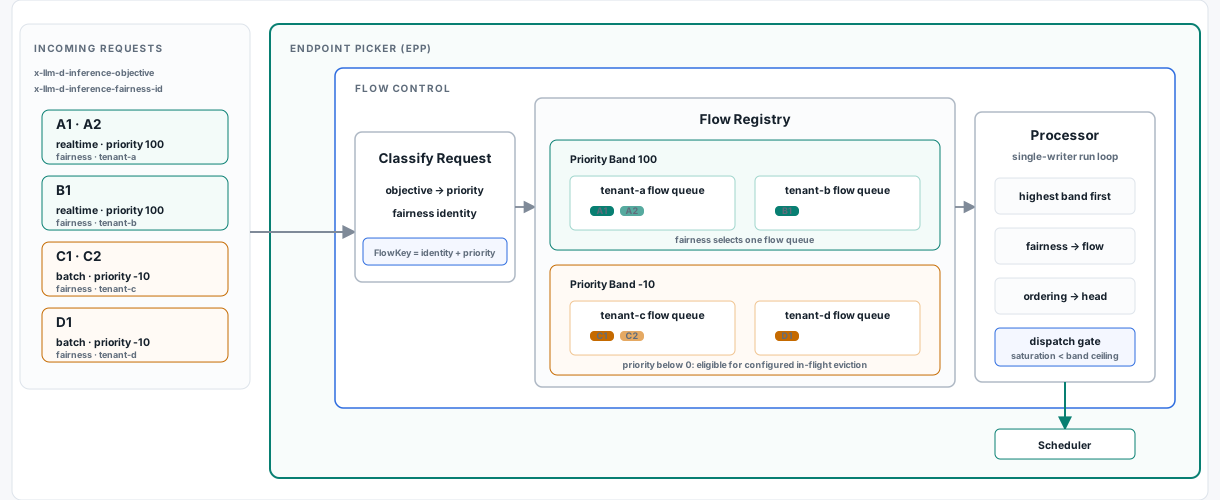
The Endpoint Picker controls what may enter; vLLM controls how much work may run. The decision map above links every suite, while this section keeps the mechanism and detailed calibration available for review.
These sweeps selected a starting configuration for the production tests. vLLM limits control how much work runs at once; Endpoint Picker limits control when new work queues. Tighter admission reduced realtime latency by shifting more waiting to lower-priority work.
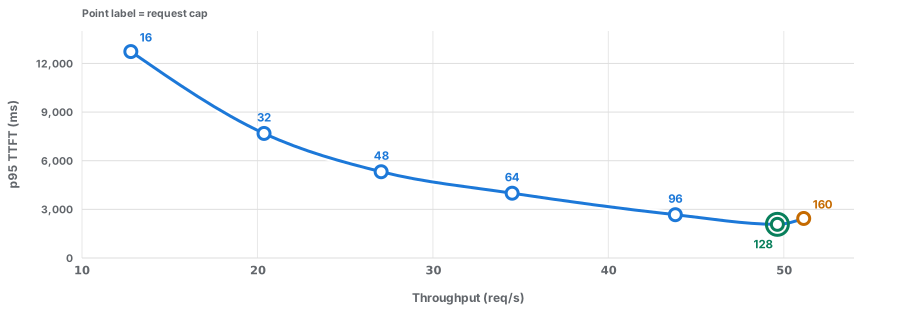
Allowing 192 instead of 128 active requests added 1.4 requests/s, while p99 TTFT rose from 1,888 to 2,613 ms.
The 8,192-token budget produced the highest throughput and lowest p95 TTFT among the three tested settings.
Limiting in-flight requests to 128 reduced p95 TTFT by 363 ms with 2.9% less throughput than the 160-request limit.
Activating flow control at eight waiting requests lowered p95 TTFT by 256 ms and throughput by 1.6% versus depth five.
The 48-request limit produced the lowest premium p95 TTFT. Increasing the limit admitted more standard work sooner, but premium latency rose.
The 0.8 threshold produced lower p95 TTFT than 0.75, while both thresholds were slower than the flow-control-off calibration.
Counting exact prompt tokens served 21.4 requests/s; adding the output estimate reduced throughput to 6.8 requests/s.
concurrencyMode: tokens: it estimates load from prompt size instead of treating every request equally. Request count and exact input tokens have three matched repeats.| Layer | Setting | Use |
|---|---|---|
| vLLM execution | 128 maximum sequences; 8,192 maximum batched tokens | Limits active requests and the token budget per scheduler step |
| Endpoint Picker admission | 128 in-flight requests; 10% detector headroom | Uses a relaxed endpoint-filter boundary above the 128-request saturation reference |
| Batch isolation | 128 in-flight requests; 15% detector headroom | Uses a larger endpoint-filter cushion; it does not reserve capacity by priority |
| Size-aware option | Exact input-token count | Accounts for prompt size when request counts misstate load |
The admission signal determines when the Endpoint Picker stops sending more work. The right signal depends on whether request count, prompt size, backend queueing, or model-memory pressure best represents the workload.
endpoint filtering boundary = detector capacity × (1 + headroom)
For the selected request-count setting, 128 requests with 10% headroom produces a filtering boundary of 140.8. The extra margin tolerates brief per-replica overshoot; it does not hold capacity aside for a priority tier.
v0.9 scope: This report covers stable v0.9's uniform pool-level usage limit and per-replica detector headroom. Priority-specific reserve and in-flight eviction are outside this report.
saturationDetector.headroomRelaxes the endpoint filter above the detector's request or token limit. It tolerates brief overshoot but does not reserve capacity by priority.static-usage-limit-policy.thresholdSets one dispatch ceiling for every priority. A value below 1.0 holds the same fraction of capacity back from all traffic.The plots compare request count and queue depth with the same prompts, traffic, model, GPU, and three repeats. Token-count results appear under Workload behavior.
Request count acted before a vLLM queue formed; both realtime tenants remained near 0.5 seconds.
Request count preserved both peers near 0.5 seconds while one same-priority tenant generated the surge.
Answer: In both production comparisons, the in-flight request limit protected realtime latency sooner. Median p95 TTFT remained near 0.5 seconds; waiting-queue detection reacted after backend queueing began, and median p95 TTFT rose to roughly 4.5–5.1 seconds.
Request size, response length, and work already running inside vLLM changed which admission setting worked best.
realtime p95 TTFT rose from 133 ms to 15,378 ms after running Batch occupied vLLM capacity.
The agentic test used larger prompts, longer outputs, and a lower request rate. It recorded higher TTFT than chat, but this comparison does not isolate one cause.
Request count lowered premium p95 TTFT; input-token admission produced more even latency across tiers.
Use request count when premium latency is the first objective. Test input-token admission when more even service across request sizes matters.
Across eight paired seeds, neither admission method was consistently faster.
The selected configuration was tested across larger model pools, repeated surges, and cache-aware routing.
Served RPS per GPU varied by at most 0.6% across one, two, and four replicas.
Flow control engaged twice; final p95 TTFT returned to 290 ms from a 299 ms baseline, with zero preemptions.
The tested prompts did not create enough additional prefix reuse to offset uneven routing: realtime and batch improved, while standard long-context traffic slowed.
Random routing remains the reference setting for this workload because prefix-aware routing did not improve latency consistently across tiers.
| Area | Method | Boundary |
|---|---|---|
| Production scenarios | Open-loop Poisson traffic, noisy sinusoidal phases, three repeats, cache off | One H100 and one model replica |
| Detector comparison | Three matched repeats for request count and queue depth | Descriptive medians and ranges; queue-depth-5 fairness remains calibration-only |
| Calibration sweeps | Closed-loop fixed concurrency | Configuration selection; production traffic carries the latency claim |
| Scale | One Endpoint Picker with one, two, and four model replicas | Scope: one Endpoint Picker |
| Prefix routing | Two model replicas, cache on, shared-prefix traffic | High repeat variance; no default change |
| Metrics | Requests, policy queues, vLLM running and waiting, KV cache, preemptions, routes | Absolute latency depends on model, hardware, request shape, and load |
Each package includes configuration, request data, traffic samples, system metrics, proof gates, and claim limits.